


Price charts can look calm right before the market chooses a direction. Avalanche, XRP, and Zcash have spent several sessions inside tight ranges, and August 15 could reveal whether those boundaries still have enough strength to contain them.
Today’s crypto price prediction examines the levels that could change each setup before the session closes. A look at the Investing.com 5 hour indicators also reveals an unusual divide. Some readings support a breakout attempt, whereas others warn that the current consolidation may continue. AVAX price, XRP price, and ZEC price therefore depend on how buyers respond when their nearest boundaries come under pressure.
What you'll learn 👉
Avalanche Price Could Target $7.50 if Buyers Clear $6.90
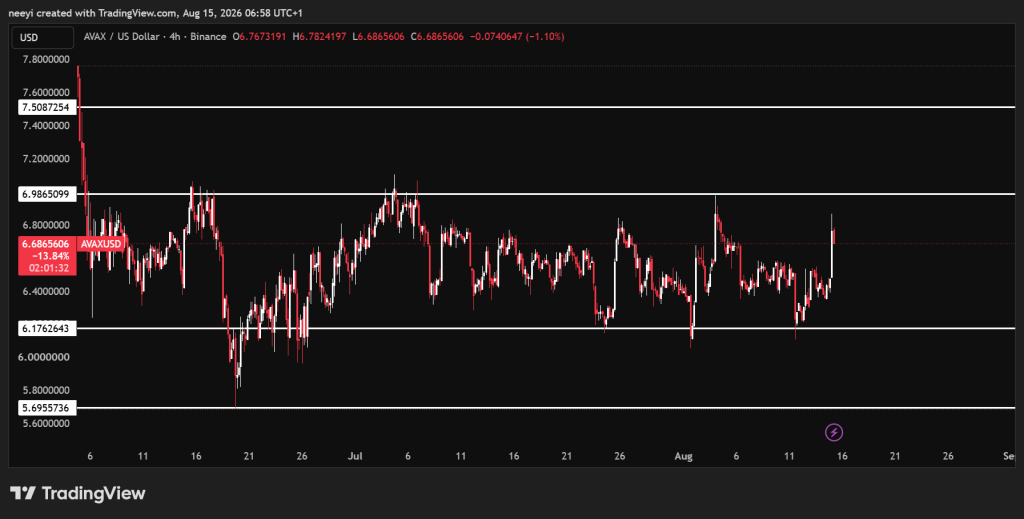
Avalanche price has traded mainly between $6.10 and $6.70 since the beginning of June. AVAX briefly dropped beneath the lower boundary during the middle of June, but the broader consolidation range remained relevant afterward.
Another similar session could keep AVAX price between those familiar levels today. However, a loss of the $6.10 support could expose $5.69 before the session ends. Buyers need to clear $6.90 before Avalanche can attempt a stronger move toward $7.50.
The Investing.com 5 hour indicators lean bullish overall. The RSI reading of 64.519 shows that buyers have control, though AVAX is moving closer to the overbought area above 70. That leaves room for further growth, but the available space is becoming smaller.
The stochastic reading of 38.292 carries a sell assessment. This reading indicates that short-term price strength remains less convincing than the RSI implies.
MACD stands at 0.04 and supports the bullish case. Its positive reading shows that upward pressure has improved. Bull and Bear Power also reads 0.41, which confirms that buyers currently have the stronger position.
| Indicator | Value | Brief Interpretation |
|---|---|---|
| RSI(14) | 64.519 | Buyers lead, but AVAX nears overbought territory |
| STOCH(9,6) | 38.292 | Short term strength remains under pressure |
| MACD(12,26) | 0.04 | Positive momentum supports a higher move |
| Bull/Bear Power(13) | 0.41 | Buyers currently control the market balance |
XRP Price Remains Trapped Near $1 as Momentum Stays Mixed
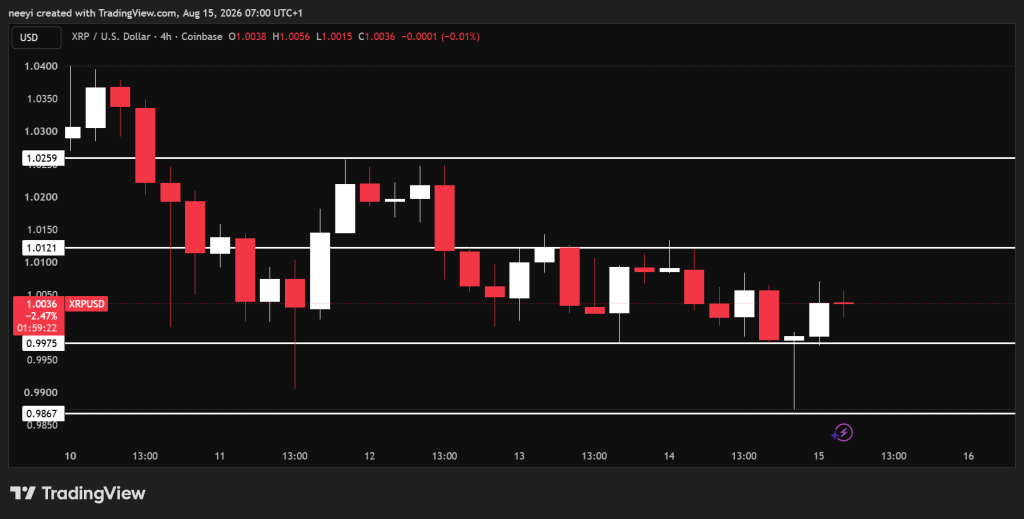
XRP price has traded mainly between $1 and $1.01 since August 11. Brief moves beyond both boundaries have occurred, but neither side has established lasting control.
Continued consolidation remains possible if the current pattern holds throughout August 15. A confirmed break above $1.01 could carry XRP toward $1.025. A drop below the lower boundary could send XRP price toward $0.98, which marked yesterday’s bottom.
The Investing.com 5 hour indicators present a mixed picture. RSI stands at 55.297 and gives a buy reading. That level places XRP above the neutral midpoint without pushing it close to overbought territory.
The stochastic indicator reads 79.474 and also carries a buy assessment. However, the reading is close to the commonly watched overbought threshold of 80, so buyers may soon face stronger resistance.
MACD stands at negative 0.001 and gives a sell reading. The figure remains very close to zero, which means bearish pressure is present but limited. Bull and Bear Power reads 0.0055, giving buyers a narrow advantage.
| Indicator | Value | Brief Interpretation |
|---|---|---|
| RSI(14) | 55.297 | Buyers hold a mild advantage |
| STOCH(9,6) | 79.474 | Strength remains high but approaches overbought territory |
| MACD(12,26) | Negative 0.001 | Weak bearish pressure limits the upside |
| Bull/Bear Power(13) | 0.0055 | Buyers maintain only a narrow lead |
Zcash Price Could Reach $509 After a Break Above $497
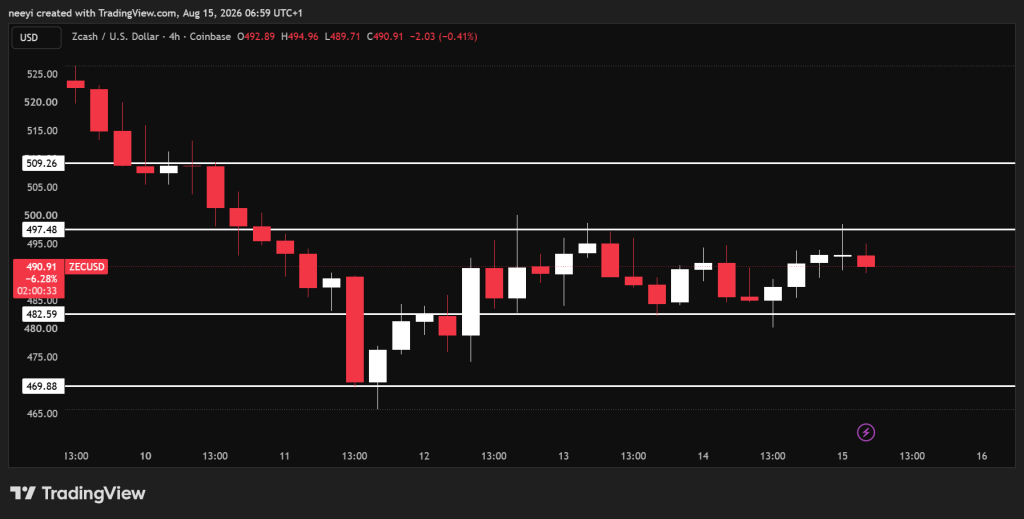
Zcash price has remained inside a consolidation range since Wednesday. ZEC has traded mainly between $482 and $497, and that pattern could continue throughout today.
A break below $482 would weaken the range and open a possible route toward $469. Stronger demand above $497 could instead push ZEC price toward $509 before the session closes.
The Investing.com 5 hour indicators favour buyers overall. RSI stands at 63.841, which confirms healthy demand without crossing into overbought territory.
The stochastic reading of 37.032 gives a sell assessment. That result points to weaker short term strength and could delay an immediate breakout.
MACD reads 0.03 and supports further upside. Bull and Bear Power stands at 0.419, which shows that buyers currently hold a clear advantage over sellers.
| Indicator | Value | Brief Interpretation |
|---|---|---|
| RSI(14) | 63.841 | Buyer strength remains healthy below overbought levels |
| STOCH(9,6) | 37.032 | Short term pressure could delay a breakout |
| MACD(12,26) | 0.03 | Positive momentum supports the bullish case |
| Bull/Bear Power(13) | 0.419 | Buyers retain control over sellers |
FAQs
Subscribe to our YouTube channel for daily crypto updates, market insights, and expert analysis.