


The latest Bitcoin chart from analyst Wimar is gaining popularity across crypto markets. The data shows a pattern that has repeated itself through every major cycle since 2011. Tops arrive every 1,430 days. Bottoms arrive every 1,460 days. And according to this model, the next bottom is already on the calendar for 2026.
History suggests the current cycle is following the same path. The 2025 all-time high arrived right on schedule. Now the same pattern points to what comes next.
What you'll learn 👉
The Bitcoin Cycle Pattern That’s Pointing to a Major 2026 Bottom
The model Wimar presents is not traditional technical analysis. It does not rely on RSI, MACD, or moving averages. Instead, it maps Bitcoin’s price action based on time. The observation is straightforward.
Major all-time highs have occurred approximately 1,430 days apart. The 2013 top, the 2017 top, the 2021 top, and the 2025 top all fit this timeline. The same consistency appears on the downside. Bear market bottoms have followed a 1,460-day rhythm. This pattern has held through every cycle since 2011.
🚨WARNING: SOMETHING EXTREMELY BAD IS COMING!!
— Wimar.X (@DefiWimar)
Everyone says the cycle is dead.
But this pattern has NEVER been wrong.
TOP → 1,430 DAYS → TOP
2013 → 2017 → 2021 → 2025
BOTTOM → 1,460 DAYS → BOTTOM
2011 → 2015 → 2018 → 2022 → 2026
The latest top arrived exactly on…https://t.co/a8JkaUTKdvpic.twitter.com/Hxu89n6v7sJuly 17, 2026
The model suggests Bitcoin operates on a four-year boom-and-bust cycle. The halving event drives much of this rhythm. Supply cuts every four years create scarcity. That scarcity fuels bull runs. The subsequent corrections then play out over a similar timeframe.
Wimar’s chart plots this entire history on a logarithmic scale. The price scale matters because Bitcoin reaches much higher dollar values each cycle. The percentage gains shrink over time. This reflects increasing market maturity and growing liquidity.
Why the 1,430-Day Top and 1,460-Day Bottom Theory Has Traders Talking
The symmetry in these numbers has traders paying close attention. The pattern shows that both tops and bottoms follow nearly identical spacing. The tops come in at 1,430 days. The bottoms come in at 1,460 days. That is a difference of only one month over a four-year period.
Each complete cycle follows the same sequence. Accumulation leads to a bull market expansion. That expansion ends in a blow-off top. Distribution follows, then a bear market decline. Capitulation marks the bottom, and a new accumulation phase begins.
While the exact price path differs each cycle, the overall market structure remains visually similar. The chart uses dotted triangles to mark each complete cycle. These triangles overlap and show the repeating nature of the pattern.
For long-term investors, this framework provides clarity on macro market phases. It is not about predicting exact prices. It is about understanding where the market stands in the broader cycle.
Bitcoin Price Analysis: Can BTC Hold Key Support Before the Next Major Move?
Looking at the current chart, Bitcoin is consolidating after the recovery from early July lows near $58,000. Price has moved into a sideways range between $63,000 and $65,000. This suggests the market is building energy before the next directional move.
The sharp decline from $66,800 established a series of lower highs and lower lows. However, the recovery from $58,000 changed the short-term structure. Since early July, Bitcoin has printed higher lows around $61,500, $62,200, and $63,000. Multiple retests of the $64,500 to $65,200 resistance zone have occurred.
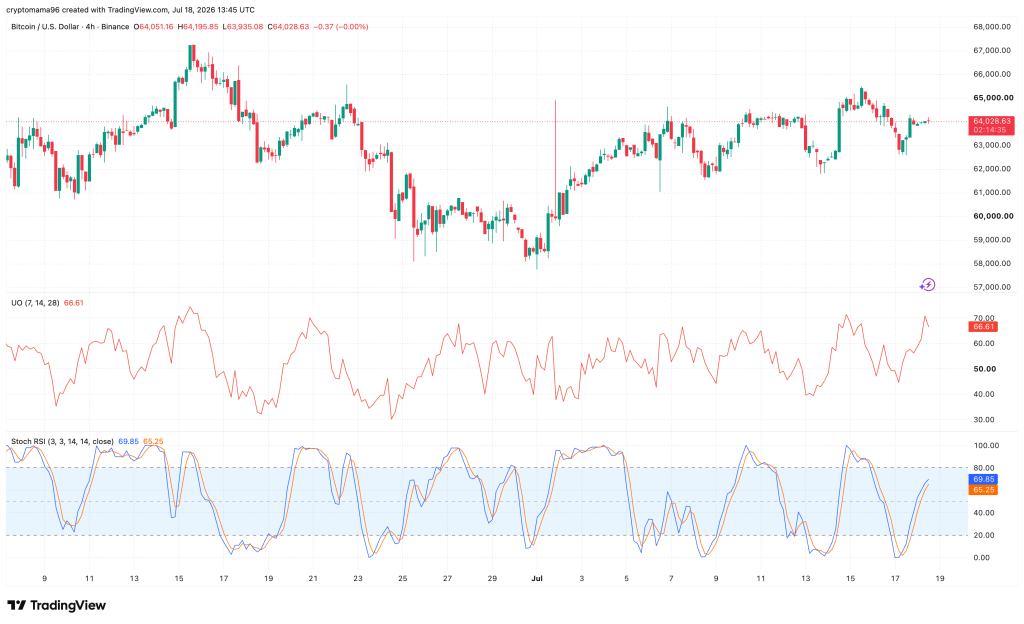
Buyers are gradually regaining control. But they have not yet produced a decisive breakout.
Key support levels to watch:
- Immediate support: $63,700-$63,900
- Major support: $62,900-$63,100
- Strong demand zone: $61,500-$62,000
- Invalidation level: Below $60,000
Key resistance levels to watch:
- Immediate resistance: $64,500-$64,700
- Major resistance: $65,000-$65,300
- Swing resistance: $66,500-$66,800
A confirmed 4-hour close above $65,300 would likely cause another bullish impulse toward the previous swing highs.
The pattern forming is bullish range consolidation. Higher lows continue to develop. Sellers repeatedly defend the $65,000 area. But buyers absorb every dip toward $63,000. This resembles a classic continuation structure where bulls are building momentum for a breakout.
Bitcoin Price Prediction: What Happens if History Repeats One More Time?
Momentum indicators offer additional context. The Ultimate Oscillator sits at 66.6, above 50 and approaching overbought territory. This suggests buying pressure is increasing. However, Bitcoin is approaching an area where short-term profit-taking could occur.
The Stochastic RSI shows %K at 69.9 and %D at 65.3. Momentum has recovered strongly from oversold conditions. The oscillator is climbing toward the overbought zone at 80. This favors additional upside in the near term, but traders should watch for a bearish crossover if price fails at resistance.
The short-term trend is bullish. The medium-term trend is neutral to bullish. The long-term structure shows a recovery phase after the previous correction.
Bullish scenario: If Bitcoin holds above $63,800 and breaks $65,200 with strong volume, the next upside targets become $66,000, $66,800, and $67,500-$68,000.
Bearish scenario: If BTC fails to break resistance, expect another rejection toward $63,000. A loss of $62,900 would expose $62,000, $61,500, and potentially $60,000. Only a sustained break below $60,000 would significantly weaken the current bullish structure.
Read also: Can ADA Price Still Reach Top 10 Crypto as Cardano Battles One Crisis After Another
Our Opinion: Is the Next Bitcoin Crash a Threat or the Opportunity of the Cycle?
The Wimar model presents a clear framework. Bitcoin has followed a predictable four-year rhythm throughout its history. The 2025 top arrived on schedule. The model now points to a 2026 bottom.
For long-term investors, this is a known pattern. The cycle has repeated multiple times. Each bottom has presented a buying opportunity. Each subsequent top has rewarded those who accumulated during the fear.
The current consolidation between $63,000 and $65,000 suggests the market is pausing. The next directional move could decide whether Bitcoin continues toward the projected bottom or breaks higher first.
Frequently Asked Questions
Subscribe to our YouTube channel for daily crypto updates, market insights, and expert analysis.