


The Bitcoin price is trading at $82,925, down 0.5%, with buyers facing a key test after BTC failed to hold above $85,000.
Institutional demand gives the market a strong counterweight: US spot Bitcoin ETFs attracted about $2.39 billion from September 21-25, including a record $999 million in one session, pushing cumulative ETF inflows since launch to about $57.6 billion.
Strategy also purchased 1,665 BTC for $142.7 million, taking its holdings to 847,666 BTC. Yet Glassnode places a dense long-term-holder supply zone around $84,000-$85,000. So, where can the Bitcoin price go today?
What you'll learn 👉
News Pushing Bitcoin Price
September 30 brings several US economic releases that could produce volatility for the Bitcoin price. ADP Non-Farm Employment Change is due at 1:15pm Nigeria time, with a forecast of 73K versus 38K previously.
At 1:30pm, Core PCE is expected at 0.3% versus 0.2% previously, Final GDP at 1.5%, and the Final GDP Price Index at 6.4%. Core PCE matters because it is the Federal Reserve’s preferred inflation measure, so a hotter reading could strengthen rate expectations and weigh on risk assets.
The Bitcoin price also faces a broader yield problem. BTC has fallen for five straight sessions, losing 2.9% across those sessions, as Treasury yields moved higher. That creates a difficult backdrop for risk assets, especially if the economic numbers come in hotter than forecasts. A weaker employment figure or softer inflation reading could produce the opposite reaction by reducing pressure on interest-rate expectations.
Institutional demand remains an important counterweight. Bitcoin ETFs brought in $2.39 billion between September 21 and 25, with daily inflows reaching $999 million on September 21 before declining to $134.5 million on September 25.
Strategy added another 1,665 BTC at an average $85,681, spending $142.7 million. These purchases provide evidence of continued demand, but the BTC price still needs to overcome the $84,000-$85,000 supply zone identified by Glassnode.
What Is Bitcoin Chart Showing?
We had a look at the BTCUSD 4-hour chart, and the technical picture is clear around the major levels. The Bitcoin price climbed from roughly $75,500 in mid-September to above $87,000 on September 22 before falling back.
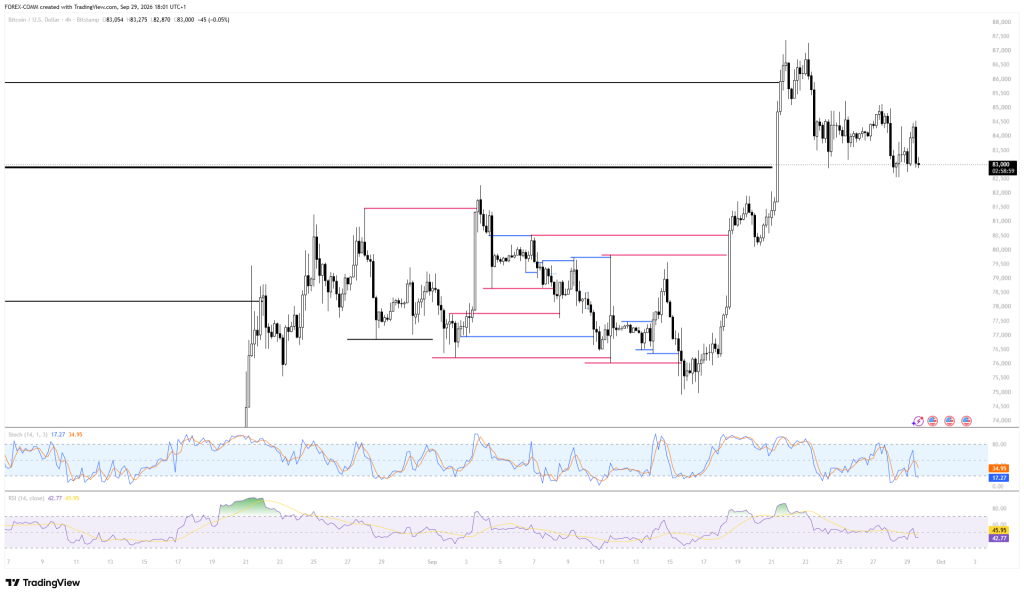
The recovery produced a higher high, but the rejection from the $86,000-$87,000 region has left BTC below the major $86,000 resistance marked on the chart.
The Bitcoin price is now around $82,925, almost directly on the chart’s $83,000 support. This level matters because BTC has tested the area several times after the move from $87,000. A sustained break below $83,000 would expose the next visible support around $80,500, followed by $78,500-$77,000.
Momentum indicators also favour caution. The 4-hour RSI is 42.77, below its moving average at 45.95, placing momentum below the neutral 50 area. The Stochastic indicator is at 17.27, below its signal line at 34.95, meaning short-term momentum is weak and the indicator is entering oversold territory. That can allow a rebound, but price confirmation is still needed.
Related Bitcoin News: Here’s Where Bitcoin and Ethereum Prices Might Go This Week
Where Will Bitcoin Price Go Today?
Bullish path:
A reclaim of $83,000, followed by a break above $84,500-$85,000, could open the way toward $86,000-$87,000. The $84,000-$85,000 supply zone remains the key hurdle, so buyers need to clear that area before the higher target becomes technically relevant.
Range path:
If $83,000 holds but $85,000 remains intact, the Bitcoin price could trade between $82,000 and $85,000 through the US data releases. The chart supports this scenario because BTC has spent several sessions consolidating inside that region.
Bearish path:
A decisive break below $83,000 could send BTC toward $80,500, with $78,500-$77,000 becoming the next major support zone. The $77,000 area also lines up with previous price structure on the 4-hour chart.
Frequently Asked Questions
Subscribe to our YouTube channel for daily crypto updates, market insights, and expert analysis.