


Solana price has fallen below $120 after its rally stalled near $125, leaving traders focused on whether support around $117 can hold.
- Solana price has retreated from $124.62 after failing to break the $125 level on the daily chart.
- Price has fallen below $118.75, while the 4-hour chart shows negative Chaikin Money Flow.
- The $117 area is the immediate test, followed by $116.32 and $112.50 if selling continues.
- A recovery above $120.29 would put the $124–$125 resistance area back in focus.
SOL traded near $117.50 on Sep. 29, about 5.7% below its Sep. 27 high of $124.62. CoinGecko put the token near $117.85, down about 1.6% over 24 hours.
SOL began the past week near $115 and climbed toward $125 before giving back part of the advance. The reversal gathered pace after the token slipped below $120, a level it had crossed during the rally but could not hold on its latest attempt.
The retreat followed a sharp rise from the mid-September area near $97. SOL remains well above that level, but the move from $124.62 to roughly $117.50 has put the latest leg of the rally under pressure. The daily and 4-hour charts now place the next tests on opposite sides of the current price: support near $117 and resistance from about $120 to $125.
Why is Solana price down?
SOL turned lower after approaching $125, which the daily chart marks as a major Murrey Math resistance level. The price reached $124.62 on Sep. 27, then fell over the following two days and moved below the indicator’s $118.75 level.
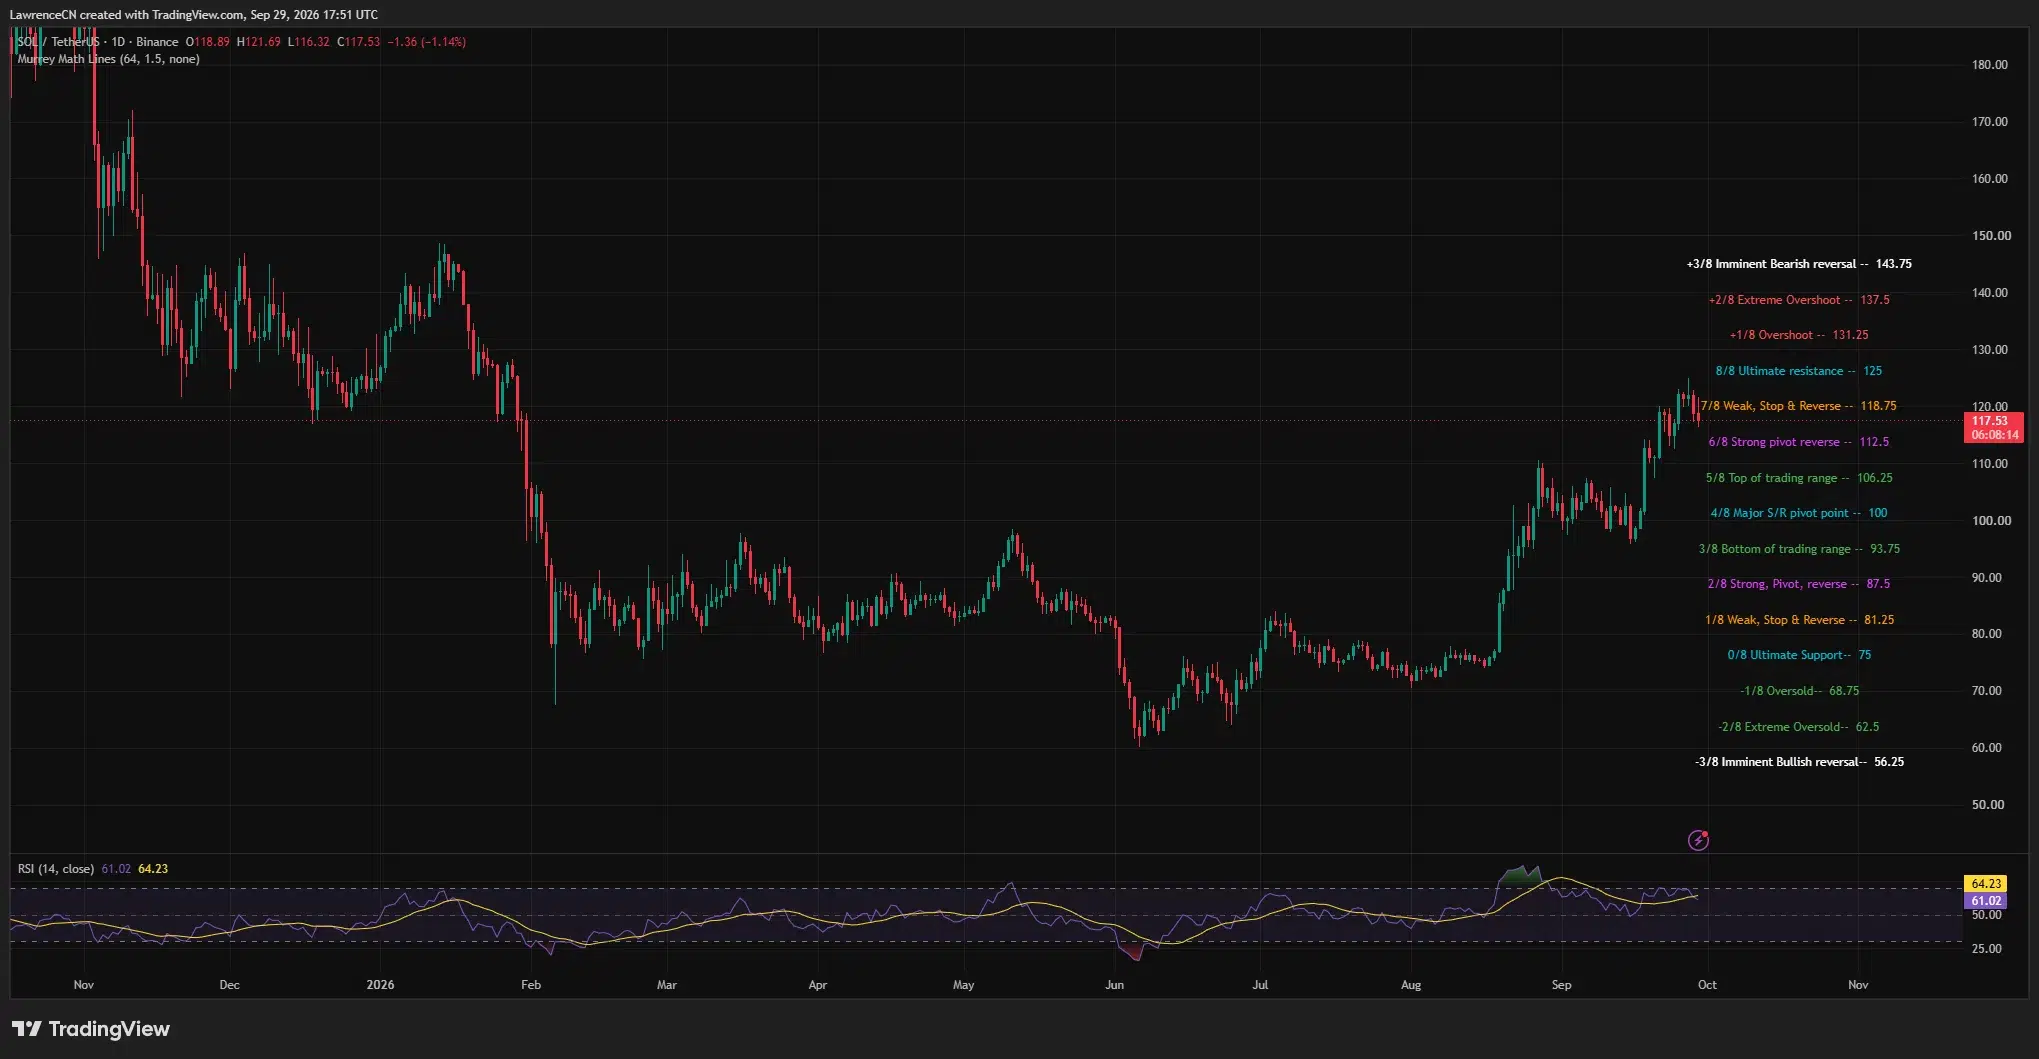
The charts show where the rally stalled and how far SOL has pulled back. They do not establish a single cause for the decline. The move is consistent with traders selling into resistance after the recent advance, while the 4-hour money-flow reading shows that selling pressure has increased over its measurement period.
On the daily chart, the 14-day relative strength index stood near 61, down from its recent highs and below its moving average near 64. The RSI remains above 50, meaning recent gains still outweigh losses over the indicator’s period. Its decline, however, shows that upward momentum has weakened since SOL approached $125.
The 4-hour chart gives a closer view of that change. SOL traded near $117.59, below the Bollinger Bands’ middle line at $120.29. Chaikin Money Flow had dropped to −0.15, a negative reading that points to increased selling pressure on that timeframe.
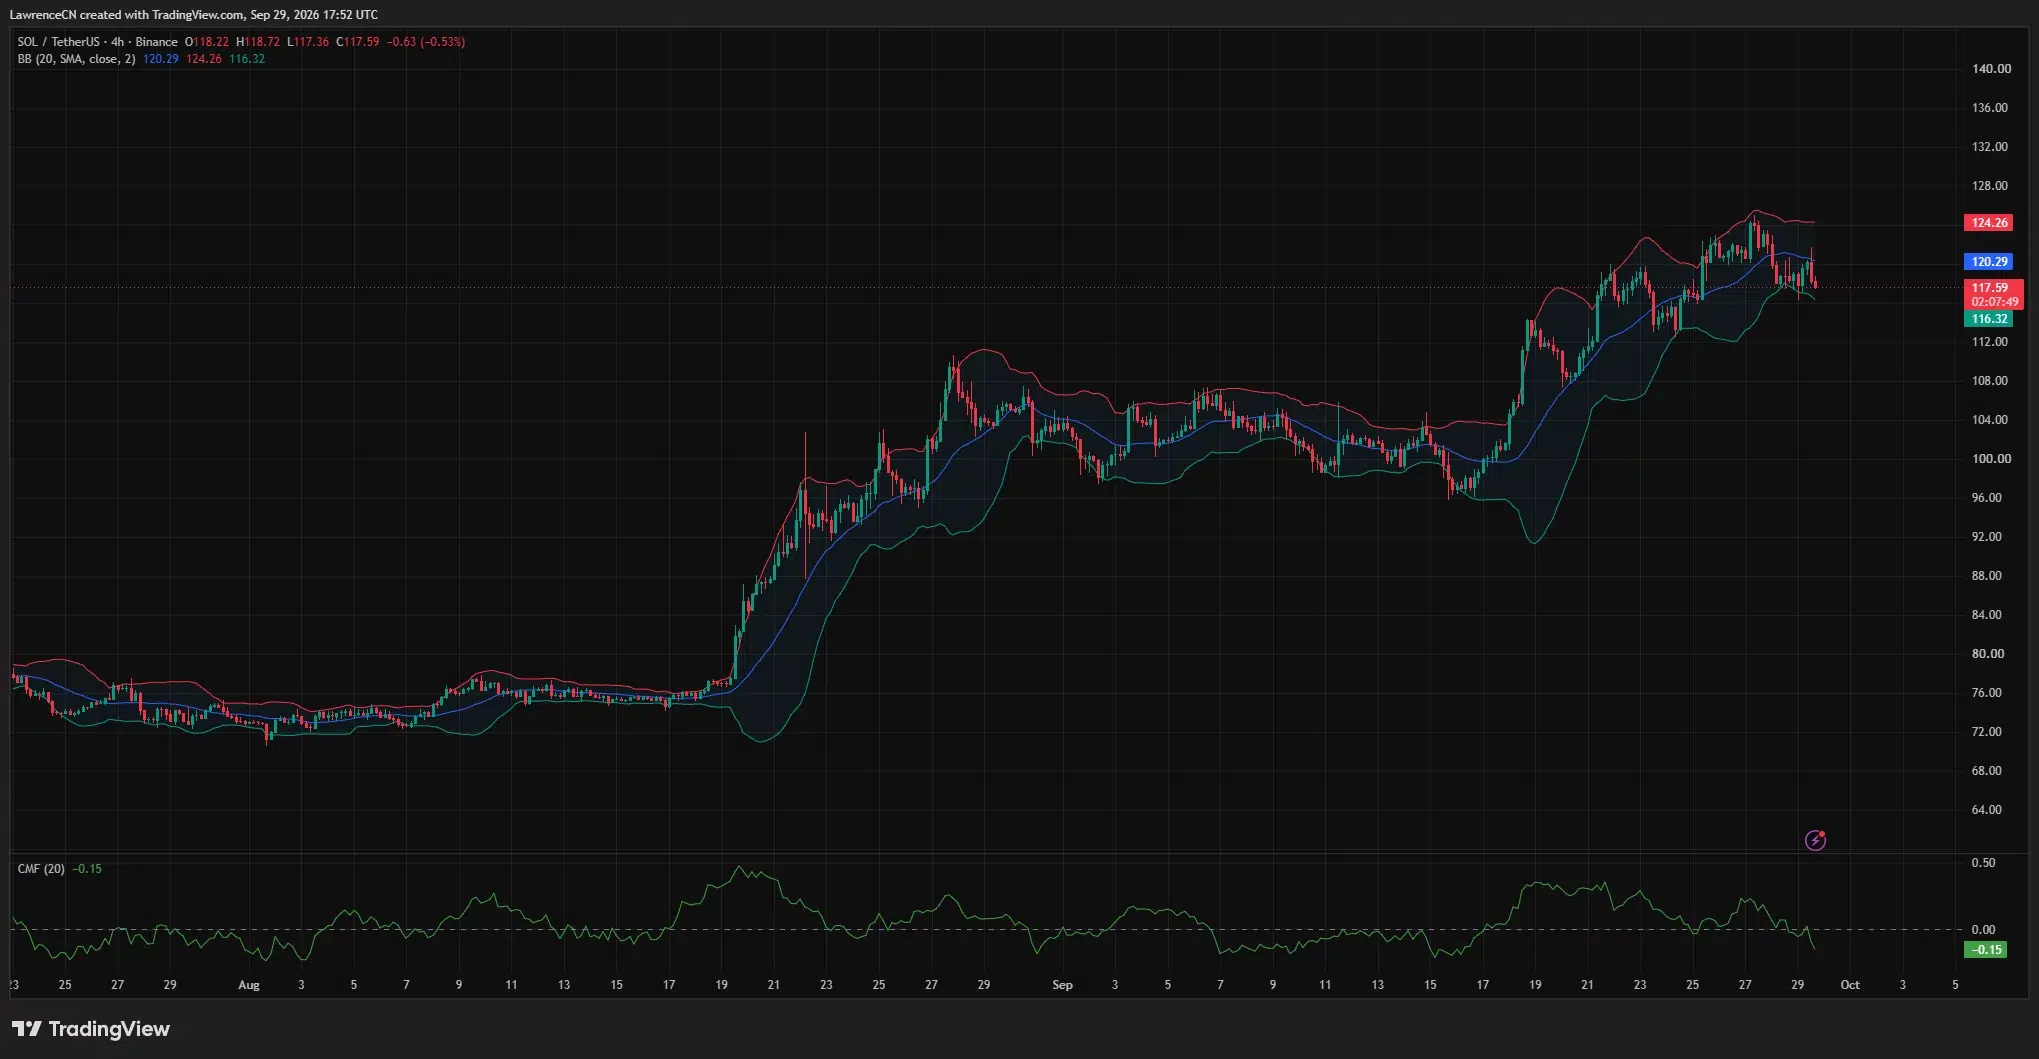
SOL also traded close to the lower Bollinger Band at $116.32. A move beneath it would place the daily chart’s $112.50 level in focus. If buyers instead push SOL back above $120.29, the upper 4-hour band near $124.26 would become a nearby test before the $125 daily resistance level.
Analysts are watching the same area from different angles. Daan Crypto Trades said in a Sep. 29 post that SOL had moved above resistance at $117 and identified $148 as a possible target if that level held. His chart marks $117 as the support needed to keep that longer-range setup in place; SOL has not yet cleared the resistance near $125.
In a separate Sep. 29 post, analyst Batman said SOL had broken below a rising trendline. He said the token would need to reclaim both the trendline and a nearby support area to restore the earlier setup. His chart shows the risk of another rejection if SOL attempts that recovery but fails.
The difference between the two views rests on what happens around the current price. A hold above $117 would keep Daan’s identified support in play. A recovery through $118.75 and $120.29 would provide stronger evidence that buyers are regaining ground. Further losses would leave the broken trendline and lower chart levels in focus.
Can SOL hold $117 before another attempt at $125?
CoinGlass’ three-day liquidation heatmap shows a cluster of estimated liquidations around $117, close to SOL’s latest price. It also shows bands above the market around $121–$123 and $125–$126.
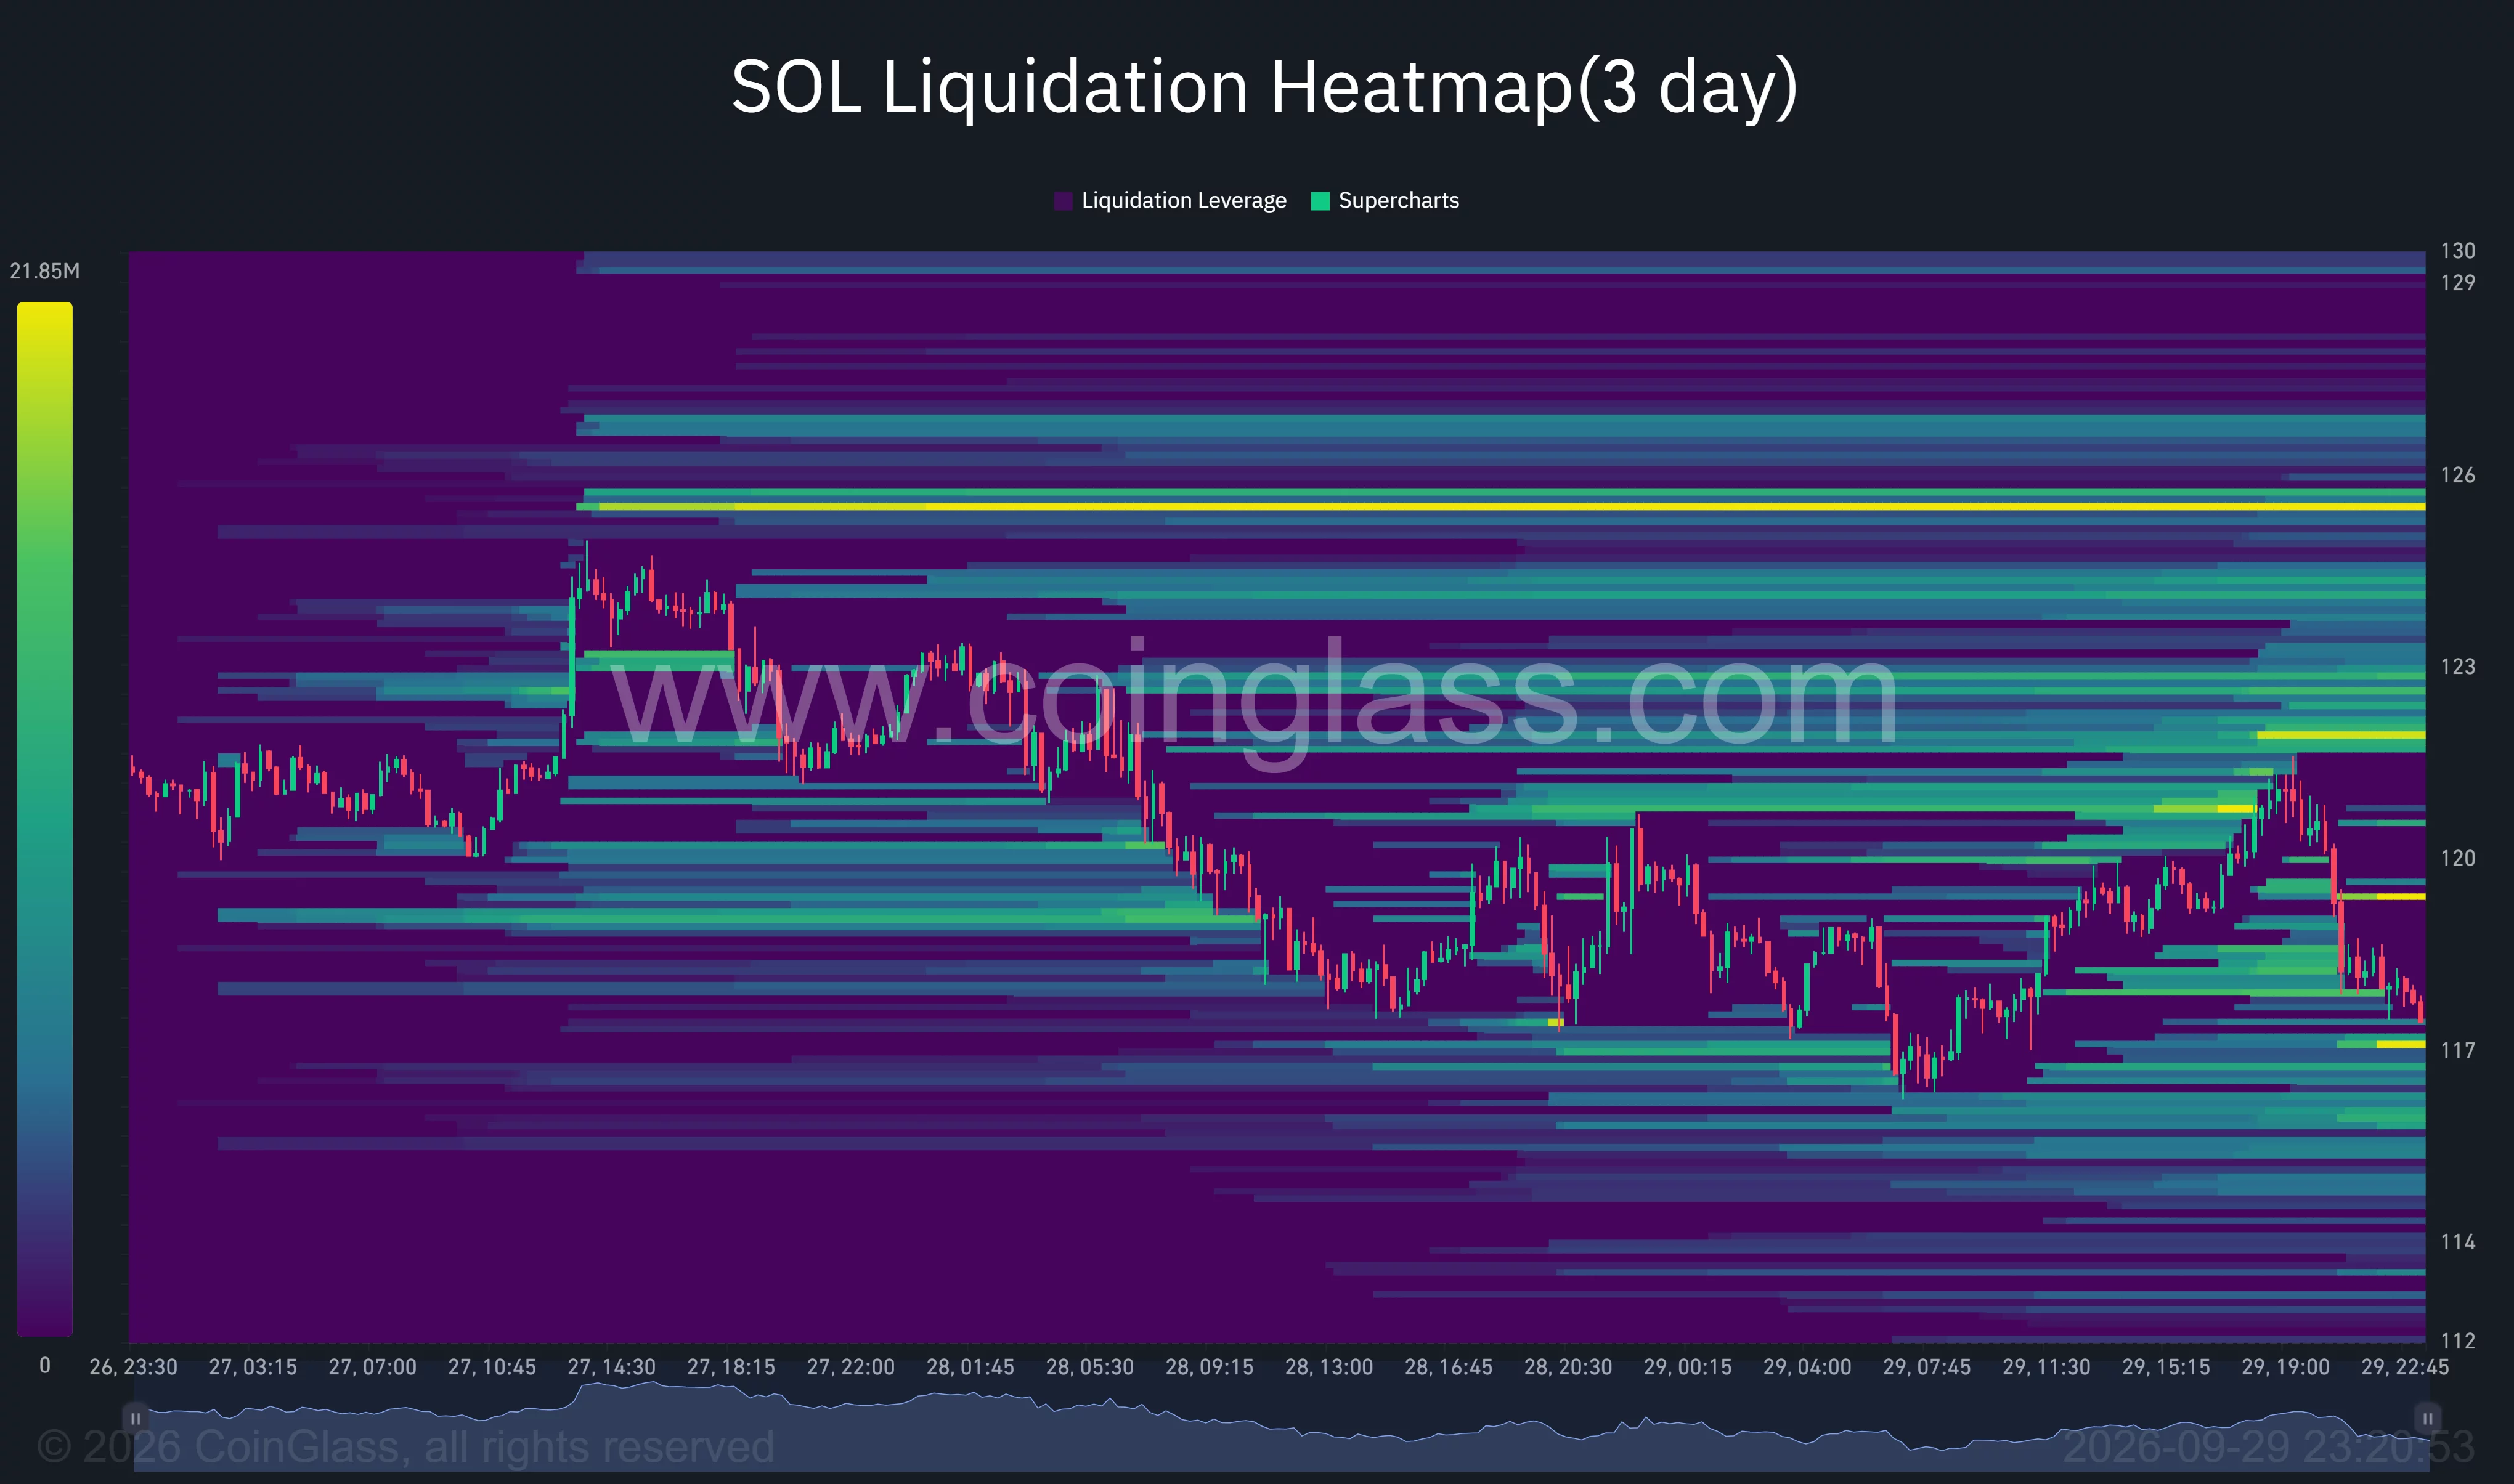
Those bands indicate where leveraged positions could face liquidation if SOL reaches the levels. They do not show that price will necessarily move toward them. The latest trace on the heatmap shows SOL falling back toward $117 after a brief move above $120 on Sep. 29.
The $117 area therefore carries immediate weight for both the price chart and the liquidation map. A break below it would bring the 4-hour lower Bollinger Band at $116.32 into view. The next marked level on the daily chart sits at $112.50, roughly 4% below SOL’s price near $117.50.
On the upside, SOL first needs to regain $118.75 and the 4-hour middle Bollinger Band at $120.29. A sustained move above those levels would put the heatmap’s $121–$123 bands ahead of the recent high at $124.62 and resistance at $125.
For now, the daily RSI shows that SOL retains part of its recent upward momentum, while the 4-hour chart shows sellers pressing the price below $120. Whether SOL holds around $117 will determine if the pullback remains contained or extends toward the next daily support at $112.50.
Disclosure: This article does not represent investment advice. The content and materials featured on this page are for educational purposes only.