
KCEX Newbie Academy|Understanding Candlestick Charts
When trading cryptocurrencies, the most basic and commonly used technical analysis tool is the Candlestick Chart. Understanding the structure and meaning of candlesticks helps you gauge market sentiment and trends more accurately, leading to more informed trading decisions.
1. What is a Candlestick?
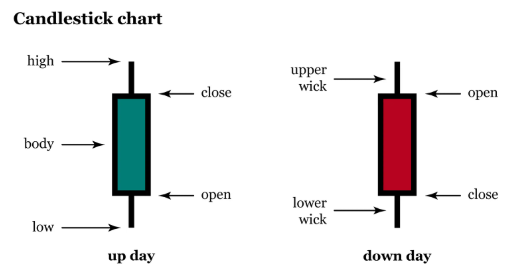
A candlestick, also known as a Japanese candlestick, displays price movement over a specific period (e.g., 1 minute, 1 hour, 1 day). Each candlestick shows four key price points:
-
Open: Price at the beginning of the period
-
Close: Price at the end of the period
-
High: Highest price during the period
-
Low: Lowest price during the period
Candlesticks consist of:
-
Body: The area between the open and close
-
Upper Shadow: The line between the high and the top of the body
-
Lower Shadow: The line between the low and the bottom of the body
2. How to Read a Candlestick?
-
Green (or White) Candlestick: Close is higher than open—bullish (buying pressure).
-
Red (or Black) Candlestick: Close is lower than open—bearish (selling pressure).
3. Common Basic Candlestick Patterns
Here are some typical patterns and their signals:
-
Bullish Engulfing:
A large green candle with a close far above the open—strong buying pressure.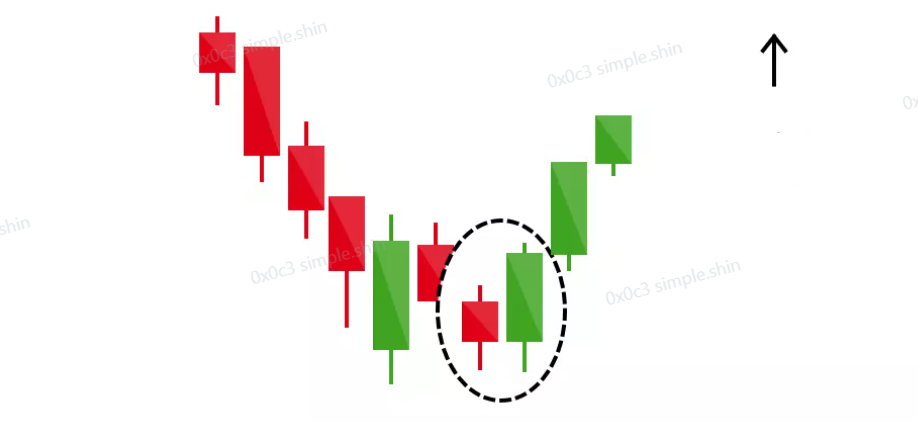
-
Morning Star:
A red-to-green reversal pattern at the end of a downtrend—potential reversal signal.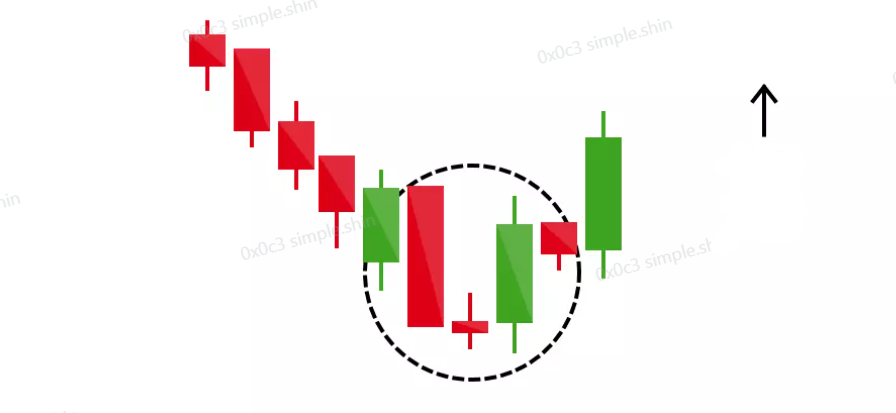
-
Doji:
Open and close are close together—short body—indecision or market hesitation.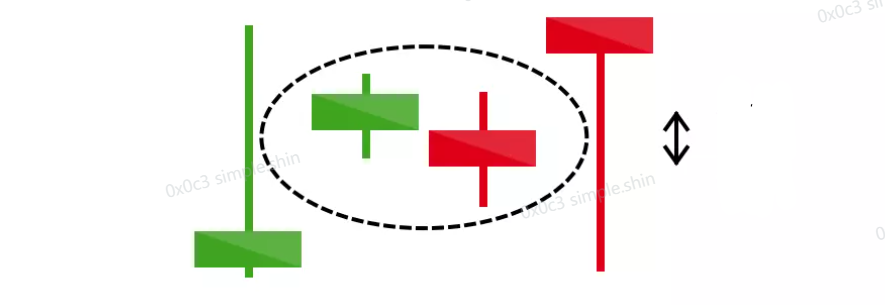
-
Bearish Engulfing:
A large red candle that engulfs the previous green candle—potential trend reversal to the downside.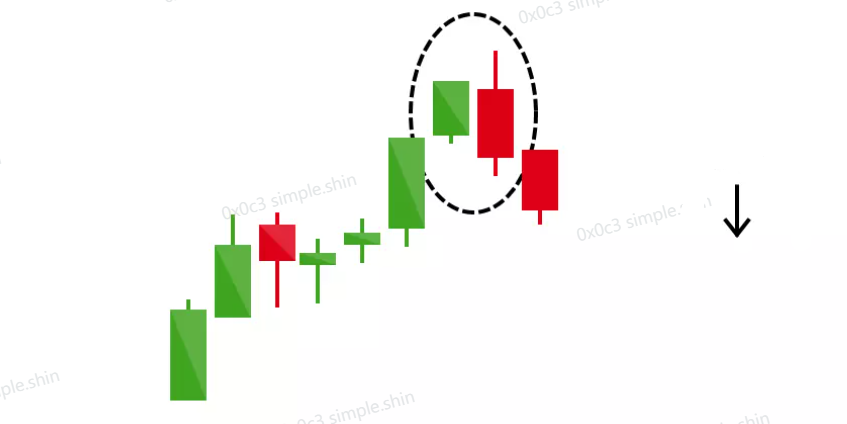
4. Candlesticks Need Context
A single candlestick shows only immediate sentiment. For effective analysis:
-
Combine with volume to confirm momentum.
-
Analyze multiple candlestick patterns (e.g., three white soldiers, hammer).
-
Use support/resistance zones and moving averages for confirmation.
5. KCEX Tips
-
Candlesticks alone cannot predict future moves—always combine them with risk management, stop-loss, and fundamental analysis.
-
Beginners should practice on daily charts (D1) before exploring hourly or minute charts.
Conclusion
Learning to read candlesticks is like learning the language of the market. Mastering candlestick patterns and logic is your first step into technical analysis and stable trading. KCEX will continue to provide practical trading knowledge to help you on your trading journey.
Disclaimer:
This content is for educational purposes only and does not constitute investment advice. Cryptocurrency trading involves volatility and risk—please assess your own risk before participating.